Syllabus and Course Overview

Brief Introduction

About me:

  • I’m an Assistant Professor in the econ dept.
  • My research is on the development of skills (“human capital”) in early childhood and how it can be shaped by policy
  • I also study labor markets and the determinants of income inequality.
  • Email: mullinsj@umn.edu (use ECON4621 in subject)

This Course - What is Econometrics?

Economics

  • Provides normative and positive theories of social phenomena
  • Markets are everywhere
  • More broadly: choice behavior under constraints

Econometrics

  • Tools for mapping theory \(\rightarrow\) data
  • Data/world fundamentally uncertain
  • Must make probabilistic statements about theories, parameters
  • Model + Data \(\rightarrow\) Policy

Will learn tools rigorously analyse data and map data to policy

R language

Assessment Plan

Three components of assessment (see syllabus on Canvas / Website for dates):

  • Writing project (20%)
    • A written report that uses data to answer an economic question
    • Presentation of results in class
    • The analysis will be conducted in groups, reports will be written individually
  • Assignments (40%).
    • Five total, will count highest four.
    • Some theory exercises. Some applications in R.
    • Get you used to data and programming. Very important.
  • Midterm and Final (20% each). Midterm: February 29 in class.

Submission Guidelines

Keep the following in mind for submitting homework:

  • Must be submitted as a Quarto or R notebook.
    • Will see how to write these in recitation
  • For theory questions, you can submit additional handwritten answers, but they must be scanned to pdf format
  • Your TA has permission to deduct grades for illegible submissions.

How to do well in this class

  • To do well, you need a deep understanding of the tools and to be able to think independently with them.
  • Come to class, make sure you really understand the exercises we do.
  • Will provide exercises to test your understanding.
  • Use recitation to help you learn programming in R and data work.

Econometrics at work: labor supply example

Issues to work through

Our tools will answer these questions

  • How can we estimate the parameters of this model?
  • How uncertain are we about the estimates?
  • How does this uncertainty change as we get more data?
  • Is the estimate sufficiently far from null (i.e. 0)?
  • Is the relationship we have found causal?
  • Can we extrapolate to a policy effect?

Application - Inequality, Institutions, and Policies

Much work in econ dedicated to answering questions around inequality and social policy:

  • What kinds of inequality in outcomes exists?
    • Income and wealth
    • Health
    • Incarceration
  • Is there inequality of opportunity?
    • Early childhood and family
    • Education
    • Labor market
    • Judicial
  • What are causal mechanisms?
  • What can policy do? What are unintended consequences?

Diagnosis - What kinds of inequality of opportunity?

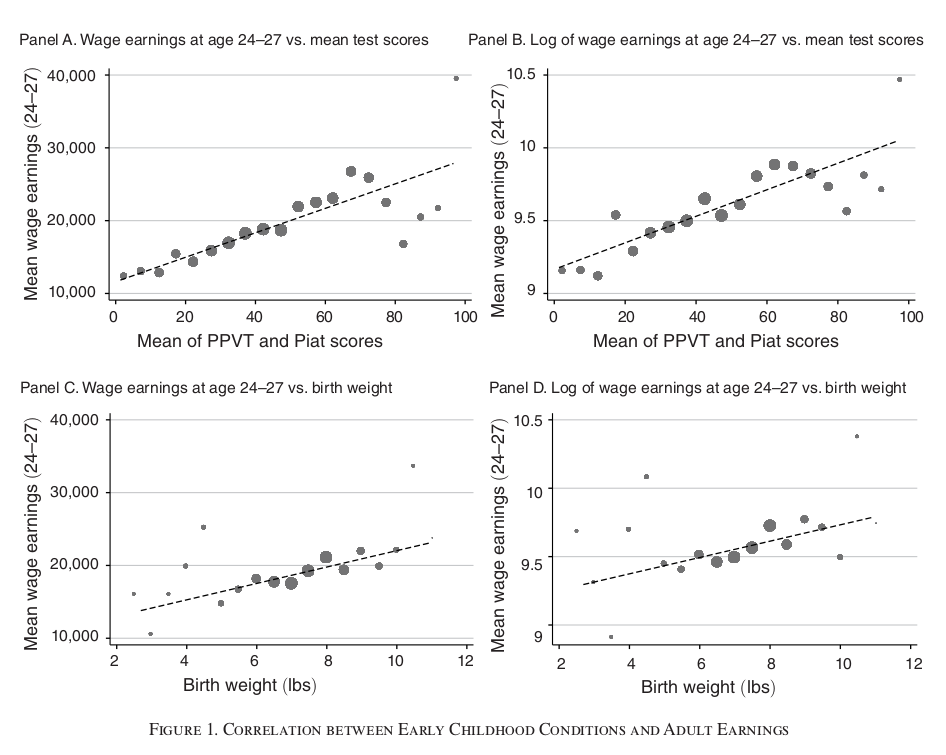
  • Strong relationship between test scores and later-life outcomes.
  • Strong relationship between birth weight and later-life outcomes.
  • These proxy for quality of early childhood environment.

Diagnosis - What kinds of inequality of opportunity?

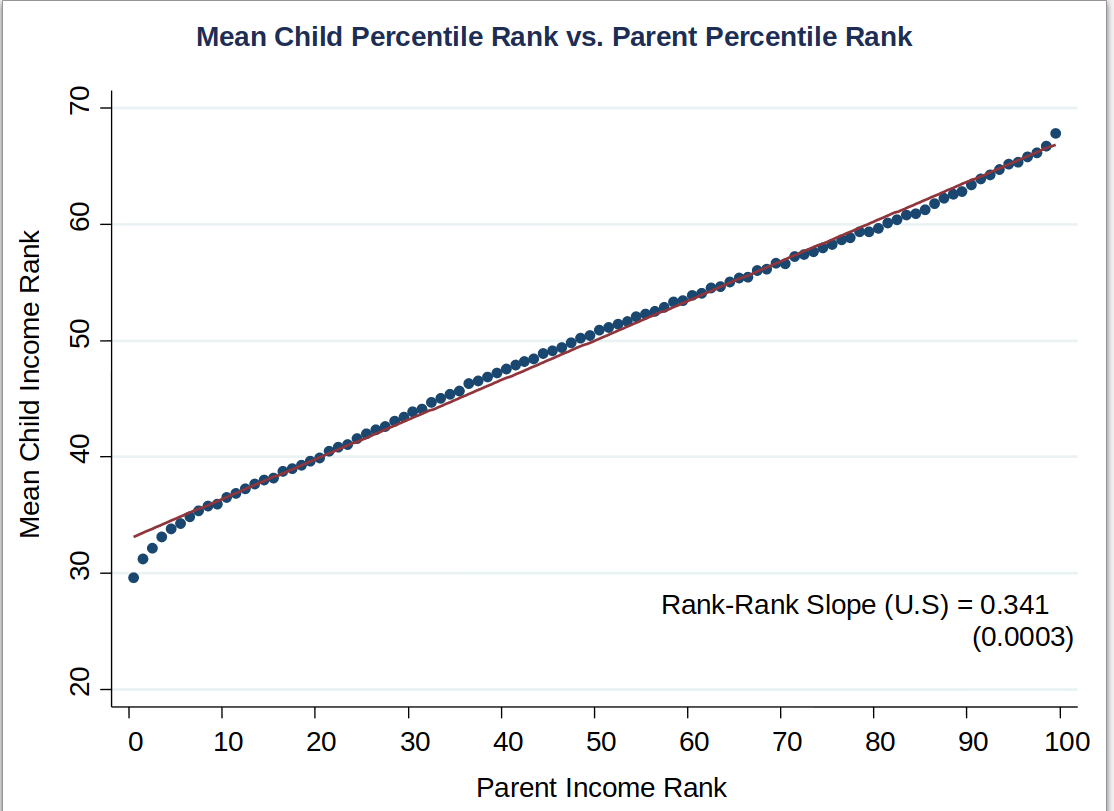
  • What does this graph tell us about economic mobility in U.S?
  • How could we use this to learn about what determines mobility?

Which relationships are causal?

Questions:

  • What are mechanisms of inequality?
  • Which observed relationships are causal?
  • What policies have an effect?
  • When can policy effects be inferred? Need a model.

Inferring Causality: Neighborhoods

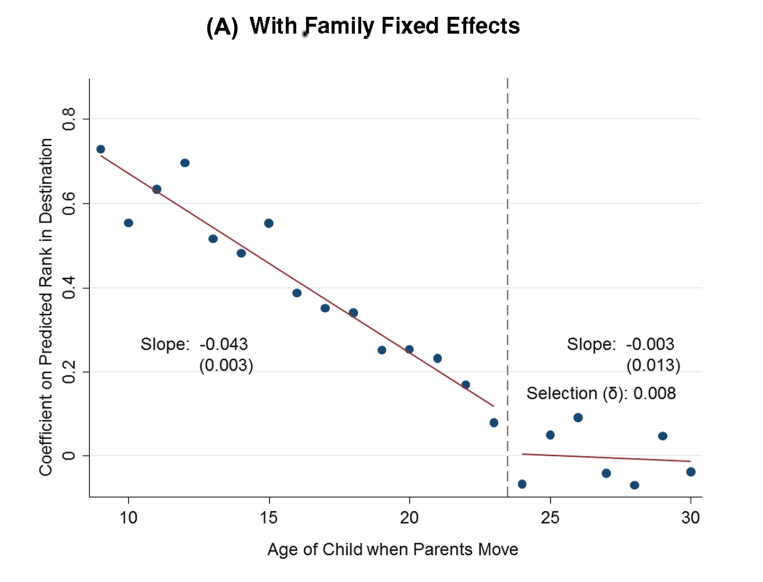
  • Using within-family variation in exposure to neighborhoods.
  • Weaker assumption for causal inference than pure cross-section.
  • What do you think?

Inferring Causality: Head Start

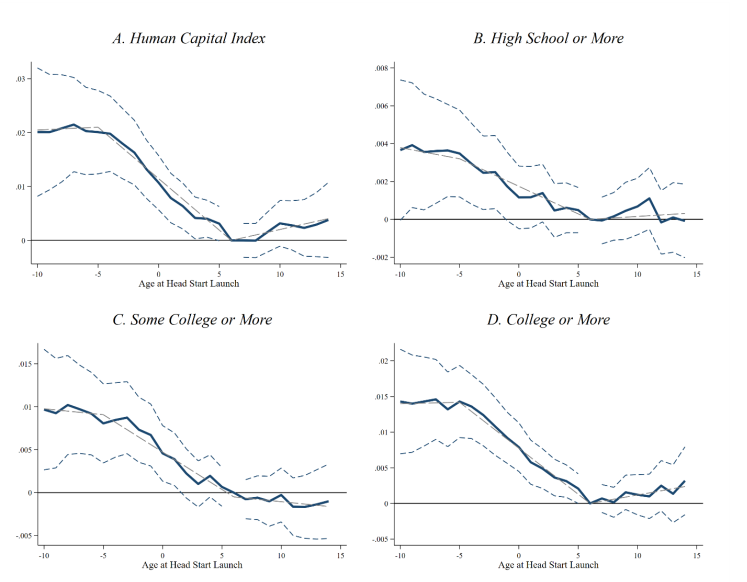
  • Head Start introduced in some counties before others.
  • Use within-county variation in exposure Head Start.
  • Evidence: long-run impacts of Head Start.

Difference-in-differences

Inferring Causality: Early Life Health Interventions

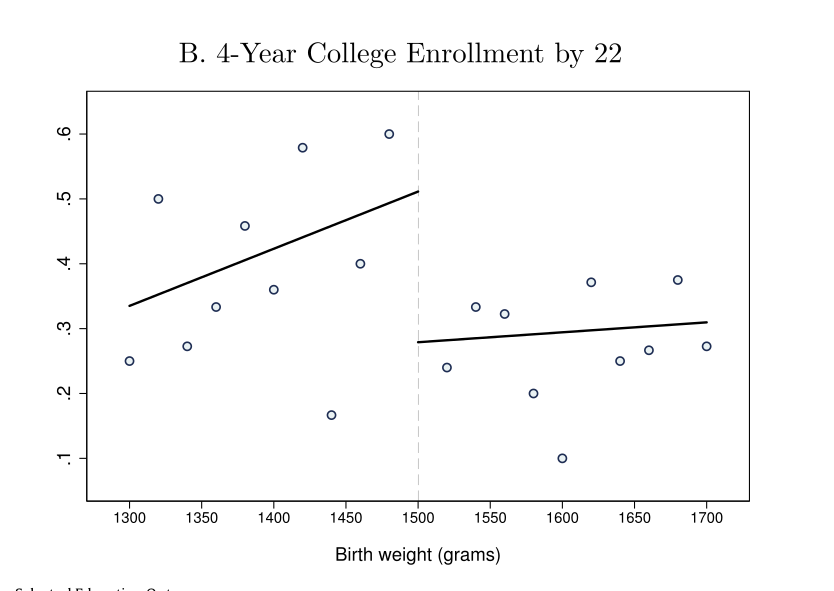
  • A “jump” in outcomes at 1500g.
  • Those just under cut-off receive extra care at birth.
  • Under weak assumptions, the size of the jump is a causal effect.

Regression discontinuity

Four Methods of Causal Inference

  • Experiments
    • e.g. Perry Preschool Intervention, Moving to Opportunity, Audit Studies
  • Difference in differences/Event Studies/Other
    • e.g. Minimum wage (Card & Krueger 1994), early childhood policies on long-run outcomes.
  • Regression Discontinuity
    • e.g. Exp. on Infant Health Care (Almond et al 2010), effect of welfare on criminal activity
  • Instrumental Variables
    • e.g. Returns to schooling, effect of incarceration on labor market outcomes, effect of school expenditure on student outcomes

Key Learning Goals

For each method we must:

  • Articulate clear assumptions under which method provides valid inference
  • Work from model to sampling theory as data grows
  • Use this to test significance of parameter estimates
  • And to derive precision of magnitudes
  • In order to conduct robust/responsible empirical work, we must master theory

References for Figures

  • Janet Currie (2011), Inequality at Birth: Some Causes and Consequences, American Economic Review 101:3
  • Chetty, Hendren, Kline & Saez (2014), Where is the Land of Opportunity? The Geography of Intergenerational Mobility in the United States, Quarterly Journal of Economics 129:4